
If you want to build a successful career in data, you need to understand that businesses do not just want numbers. They want stories. They want clear answers to their biggest problems. As a senior business intelligence analyst, I have spent years turning messy data into clear visual insights. Over time, I noticed that certain reporting templates are requested by leadership teams over and over again.
If you are an aspiring business analyst, mastering a few core dashboard concepts will put you far ahead of the competition. Power BI is currently the most popular data visualization tool in the corporate world. Learning how to navigate its features is a great start. However, knowing exactly what to build is what makes you a truly valuable asset to any company.
In this article, I will share the top ten Power BI dashboards you should practice building. Creating these specific reports will build your portfolio, improve your analytical skills, and prepare you for real world business challenges.
Why Building a Portfolio of Power BI Dashboards Matters
Before we look at the specific dashboards, we need to talk about why you should build them. When you apply for a business analyst job, hiring managers want to see proof of your skills. A certificate shows you attended a class, but a portfolio shows you can do the actual work.
Building these specific Power BI dashboards will teach you how to write complex DAX formulas. You will learn how to clean messy datasets using Power Query. More importantly, you will learn how to think like a business owner. You will start asking questions about revenue trends, cost reductions, and customer satisfaction. This business mindset is exactly what companies look for when hiring new analysts.
Let us look at the ten most important Power BI dashboards you need to create.
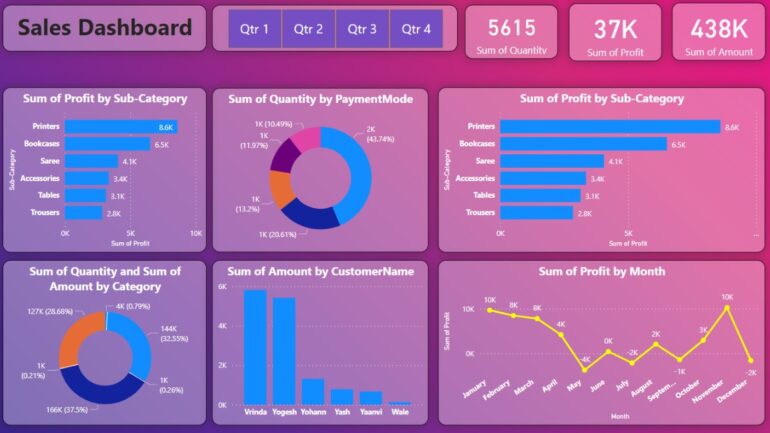
1. The Executive Summary Dashboard
The executive summary is the most critical dashboard in any organization. CEOs and top executives are very busy people. They do not have time to look at hundreds of rows of data. They need a high-level overview of the company’s performance at a single glance.
What you should include:
- Total revenue compared to the previous year.
- Overall profit margins.
- New customer acquisition numbers.
- Top performing products or services.
Why you should build it:
Building an executive dashboard teaches you how to keep things simple. You will learn how to use card visuals to show big numbers and simple line charts to show trends over time. This report trains you to focus only on the metrics that matter most to the top leadership team.
2. Sales Performance Tracking Dashboard
Every company needs to track its sales. Sales teams are highly competitive and driven by quotas. A sales performance dashboard helps managers see who is performing well and which regions need more attention.
What you should include:
- Revenue generated by each sales representative.
- Sales volume broken down by region or city.
- Win rate percentage for new deals.
- Sales forecast for the next quarter.
Why you should build it:
This dashboard helps you practice working with geographic data. You can use Power BI map visuals to plot sales across different locations. You will also learn how to create target line charts to compare actual sales against monthly goals.
3. Financial Health Overview Dashboard
Finance departments rely heavily on accurate data. A financial overview dashboard provides visibility into cash flow, expenses, and overall profitability.
What you should include:
- Earnings Before Interest, Taxes, Depreciation, and Amortization (EBITDA).
- Operating expense breakdown.
- Accounts receivable aging summary.
- Cash flow trends over the last twelve months.
Why you should build it:
Financial data requires strict accuracy. Building this dashboard will force you to become very good at writing DAX measures. You will learn how to handle cumulative totals, year to date calculations, and complex ratio formulas.
4. Customer Churn and Retention Dashboard
Finding a new customer is always more expensive than keeping an existing one. Businesses are obsessed with customer retention. A churn dashboard helps the company understand why people are leaving and how to stop them.

What you should include:
- Monthly customer churn rate.
- Average customer lifetime value.
- Net Promoter Score (NPS) tracking.
- Breakdown of churn reasons.
Why you should build it:
This report introduces you to cohort analysis. You will learn how to group customers based on when they signed up and track their behavior over time. It is a fantastic way to showcase your advanced analytical thinking to future employers.
5. Marketing Campaign ROI Dashboard
Marketing teams spend a lot of money on ads, social media, and email campaigns. They need to know if that money is bringing in actual revenue. A marketing analytics dashboard measures the return on investment for all promotional activities.
What you should include:
- Cost per lead across different channels like Google or Facebook.
- Conversion rate from website visitor to paying customer.
- Total revenue attributed to specific marketing campaigns.
- Email open rates and click through rates.
Why you should build it:
Marketing data often comes from many different sources. Building this dashboard will give you practice connecting Power BI to multiple data sources at once. You will learn how to blend Google Analytics data with CRM data to create a single source of truth.
6. Supply Chain and Inventory Dashboard
For companies that sell physical products, managing inventory is a massive challenge. Holding too much stock wastes money, while holding too little causes missed sales. An inventory dashboard helps operations managers find the perfect balance.
What you should include:
- Current stock levels across all warehouses.
- Inventory turnover ratio.
- Supplier lead times and delivery delays.
- Out of stock frequency rates.
Why you should build it:
This dashboard is great for practicing conditional formatting in Power BI. You can set up color coded alerts that turn red when stock levels drop below a certain threshold. This makes your dashboard interactive and highly actionable for the end user.
7. Human Resources and Workforce Dashboard
Employees are the most important asset of any company. HR departments use data to track employee satisfaction, hiring efficiency, and overall workforce costs.

What you should include:
- Total headcount by department.
- Employee turnover rate.
- Average time to hire new candidates.
- Diversity and inclusion metrics.
Why you should build it:
HR data involves a lot of dates and time durations. You will get excellent practice using Power BI time intelligence functions. You will calculate things like average tenure and track headcount changes month over month.
8. E-commerce Performance Dashboard
If a company sells online, they need to track every click and purchase. E-commerce dashboards focus heavily on the user journey and buying habits.
What you should include:
- Shopping cart abandonment rate.
- Average order value.
- Top viewed items versus top purchased items.
- Customer return rates.
Why you should build it:
E-commerce datasets are usually very large. Building this dashboard will teach you how to optimize your Power BI data model for speed and performance. You will learn how to create star schemas and manage relationships between fact and dimension tables efficiently.
9. IT Operations and Helpdesk Dashboard
Large companies have internal IT teams that solve technical issues for employees. An IT operations dashboard tracks how quickly and effectively these issues are resolved.
What you should include:
- Number of new support tickets created daily.
- Average first response time.
- Average ticket resolution time.
- Number of open tickets assigned to each technician.
Why you should build it:
This dashboard helps you practice creating drill through pages. A manager might look at a chart showing a spike in open tickets. They can then drill down into that specific visual to see exactly which department is reporting the most problems.
10. Project Management Tracking Dashboard
Many business analysts work alongside project managers. A project portfolio dashboard gives stakeholders a transparent view of all ongoing company projects, their budgets, and their current status.
What you should include:
- Overall project completion percentage.
- Budget variance comparing planned costs to actual costs.
- Upcoming major milestones and deadlines.
- Resource allocation and team workload.
Why you should build it:
This dashboard is perfect for exploring custom visuals in Power BI. You can import Gantt chart visuals from the marketplace to show project timelines. This adds a unique and professional look to your data portfolio.
How to Start Building These Dashboards Today
Reading about these dashboards is only the first step. You need to actually open Power BI and start building. You can easily find free, public datasets online through websites like Kaggle or the World Bank data portal. Download some sample sales data or HR data and start experimenting.
Try to recreate one dashboard from this list every single week. Start with the executive summary because it is the simplest. Then, slowly move on to more complex topics like supply chain and financial health. As you practice, you will notice your speed and confidence improving drastically.
If you are serious about becoming a professional business analyst, self-study can sometimes take too long. Getting structured guidance from industry experts can save you months of frustration. A great way to accelerate your learning is to enroll in a formal training program. You can check out this comprehensive Power BI course to build a strong foundation. A structured course will teach you industry best practices, advanced data modeling, and the exact skills employers are testing for in interviews.
Conclusion
The role of a business analyst is not just to build pretty charts. Your job is to help business leaders make smart, profitable decisions based on factual data. By creating these ten Power BI dashboards, you are proving that you understand the core functions of a modern business.
You will understand sales, marketing, finance, and human resources. This broad business knowledge, combined with your technical Power BI skills, will make you stand out in the job market. Start building your portfolio today, keep your visuals clean, and always focus on the story the data is trying to tell.